
When developing a website, you will likely have a list of browsers and devices that you expect the site to work with. When this list is formalised, it is often called a ‘browser matrix’ or ‘browser support matrix’. If you build sites for external clients, a browser matrix can form part of your agreement with them. If no matrix exists, you risk extra development work to fix bugs on environments you never intended to support. This post outlines the what, why and how of browser matrices, and gives some pointers for creating your own.
What is a Browser Matrix?
A browser matrix is a document that serves one or both of the following purposes:
- To limit the scope (and cost) of web development a specific set of browsers and devices.
- To limit the scope (and cost) of testing to specific set of browsers and devices.
These two purposes go hand in hand, of course; if browser choice changes how you develop a site, it will also inform your testing of that site. Beyond that, the number and variety of supported browsers can greatly affect the breadth and depth of your testing.
Your browser matrix should, at minimum, list the browsers you will support as part of your project. Ideally, you should also list which browsers you are not supporting, and give an indication of your decision-making criteria.
Why create a browser matrix?
As noted above, its main purpose is to limit the scope of development and testing to a specific set of browsers. Limiting the browsers you support can help focus your technology choices, and can also reduce your exposure to cross-browser bugs. Choosing to support only the most recent versions of browsers allows you to harness the latest technologies. Scoping your development and testing can lead to a better user experience for the environments that are supported!
Of course, any browsers not on your matrix are more likely to have bugs and missing functionality. However this is not a guarantee! If a non-supported browser is based on the same rendering engine as a supported browser then your site is likely to behave very similarly in both browsers. Opera uses Chrome’s Blink rendering engine, and all iOS browsers use the same base rendering engine (WebKit) as iOS Safari. Likewise, if you support Chrome 60 (the most recent public release at the time of writing), then it’s likely that Chrome versions 59 and below will behave in the broadly same way as 60. Obviously, the older the version the more additional bugs or missing functionality are likely to occur compared to the current version.
When a project has a browser support matrix in place, I tend to find that it makes my testing smoother. When testing a feature or fix, I’ll decide if I need to test it in one, some or all browsers. Having a definitive list of potential test environments makes this decision much simpler. Without it, you can never be sure how many browsers is ‘enough’!
What data sources should I use?
A browser matrix is only as good as the data used to create it. Picking browsers and devices based on what you/your company/your client uses will result in a matrix, but it’s unlikely to reflect real-world usage. Instead, there’s a few more reliable sources you can use. In order of preference, they are:
- Data relating to existing users e.g. from Google Analytics.
- Data for similar sites, or sites with a similar target audience. You’ll probably have to ask your industry colleagues nicely to share this with you.
- Regional data. For example if your target audience is in the UK you could use UK data from a source like StatCounter. This approach is okay for sites with a mainstream consumer audience, but probably not suitable if you have a niche or business-focused product.
- Global data. This isn’t recommended unless your intended audience is truly global!
If your matrix is for a brand new site, data on existing users might not exist. A significant revamp of an existing site could also lead to a change in browser usage. Still, if you have access to this data then it’s a good place to start.
Public data sources
If you have no data for existing users or similar sites, there’s lots of options available for regional or global data. I recommend these sources:
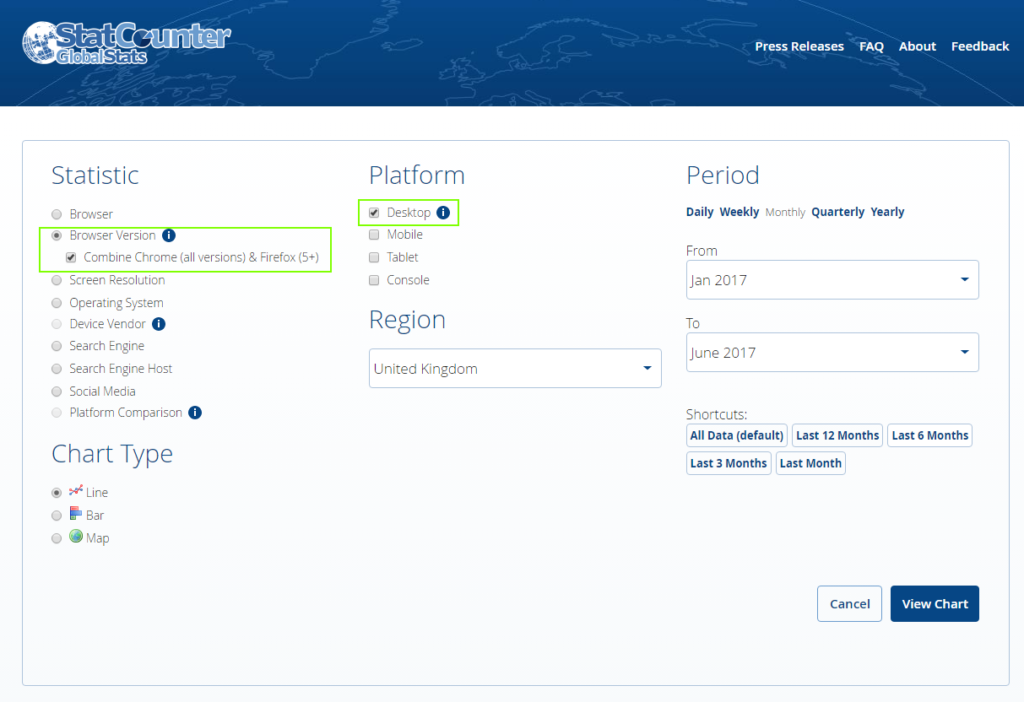
- StatCounter Global Stats – has filter options for countries, date ranges, OSes, platforms etc. It also allows you to download their data in CSV format so you can process or combine it as needed. Check out their FAQs for more details on how they collect their stats.
- NetMarketShare – this is a very similar service to StatCounter, but it can give wildly different results. I’ve heard that this because NMS’ data is more biased towards B2B sites, so if your target audience is office workers then this might be a good option. NMS has some advanced filtering options, but many of these are behind a paywall.
- MixPanel Trends. MixPanel is an analytics service that regularly publishes its aggregate data in the form of glossy reports and charts. The data is quite US-centric, but it’s still a useful reference.
- Apple’s App Store Support page – contains a regularly-updated pie chart of global iOS version usage. Useful as a secondary data source, or for deciding when to upgrade test devices to a newer iOS version.
- Android Dashboards – pie charts and tables of global Android version usage, screen sizes and densities, and OpenGL ES versions. Again, a helpful secondary source that help you choose which test devices to buy and which Android versions to install.
Ideally, you should combine these data sources to give a better picture of your site’s likely browser usage. You can also use these public sources to augment private data. For example, I’ve often struggled to get info on iOS and Android versions from Google Analytics.
Which data points should I use for my browser matrix?
So, you’ve decided where your data is coming from. Next, decide what data you actually want to collect. For me, the main ones are:
- Platform (desktop VS mobile VS tablet, or desktop VS mobile + tablet). If you’re not building a dedicated tablet experience, you can probably get away with combining mobile and tablet data.
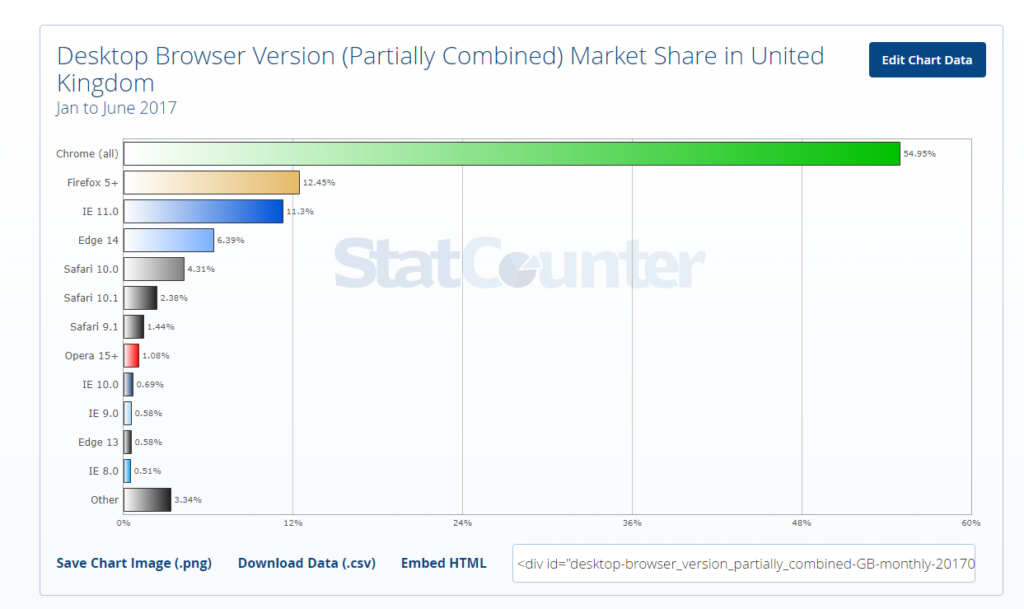
- Desktop browser usage. If you’re using StatCounter, I recommend looking at Browser Versions (with the ‘Combine Chrome (all versions) & Firefox (5+)‘ option selected) so major versions of IE and Safari are split out as separate browsers.
- Mobile browser usage and tablet browser usage, or mobile + tablet browser usage (combined).
- iOS vs Android usage on mobile and tablet (or mobile + tablet).
You’ll notice that I’m recommending that you collect desktop data separately to mobile and tablet. Many browsers exist on both platforms but their capabilities can vary, so I find that it’s best to track them separately.
Secondary data points
There’s also some additional data points you might want to collect. These secondary data points can be useful for deciding which test devices to buy, which OS versions to install and where to prioritise your efforts.
- Desktop OS + Version (e.g. Windows 7, Windows 10, OS X El Capitan, macOS Sierra).
- Mobile OS versions. iOS users are generally quite quick to update to the latest version, while Android versions usage is more fragmented.
- Screen resolutions, especially on mobile and tablet.
- Mobile device manufacturers.
Unless you have enough budget to buy every popular device, choosing test devices can’t really be an exact science. However you can use these data points to help you to pick a representative cross section of devices.
Building your browser matrix
If you want your browser matrix to be transparent and reproducible, you’ll need to store and present the data in an accessible way. If you have good Google Analytics data you could do this with a GA report. However if your data comes from multiple sources you’ll probably need a spreadsheet. Here’s one I made last year:
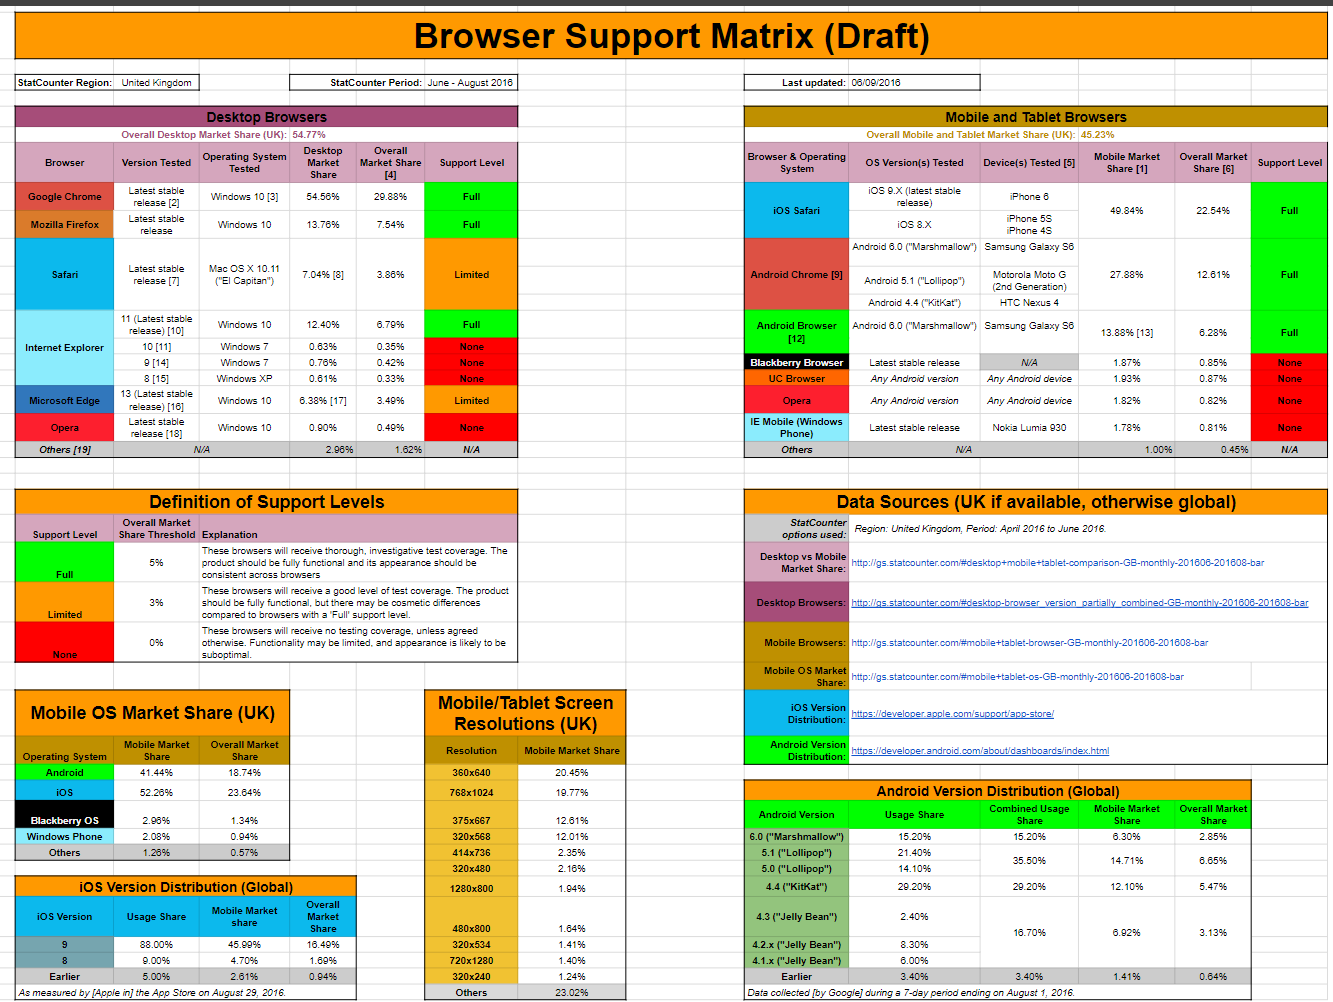
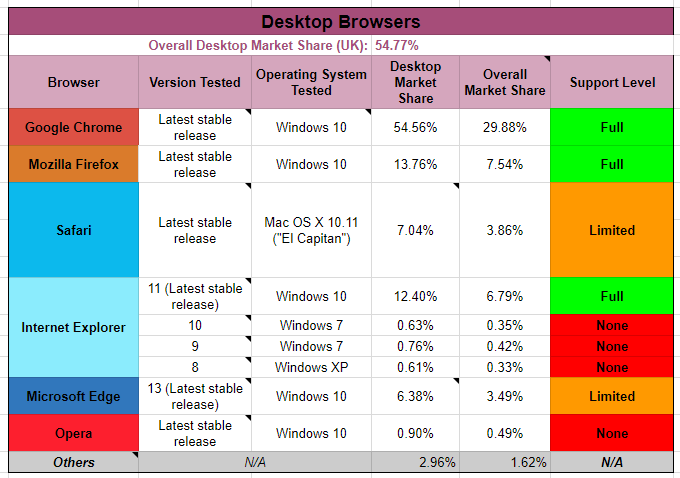
This spreadsheet has the following components:
- Desktop browser usage, normalised against the overall mobile + tablet usage share.
- I combined minor versions of Safari and Edge. Previous versions of these browsers are in the ‘Others’ row.
- Mobile + tablet browser usage, normalised against the overall desktop usage share.
- The list of mobile devices is based on what we had in the office, or what devices I’d persuaded the company to buy.
- Definition and threshold of support levels (full, limited, none).
- Mobile OS Market Share (UK).
- iOS Version Distribution (Global).
- Android Version Distribution (Global).
- Mobile/Tablet Screen Resolutions (UK).
- A list of sources.
Note: the data in this spreadsheet is almost a year old!
It’s not just about testing…
Deciding what browsers and devices to test with is all well and good, but that’s only half of the story. Your browser matrix should also help inform the technologies you use to develop your site. The amazing reference site Can I Use allows you to see which browsers support modern web technologies like CSS Grid or Date and Time input types. You can even import your GA data straight into Can I Use to get an accurate picture of how many users your technical decisions might affect.
A browser matrix can also be used during project planning to help the team decide what technical approach to take. If you have a high level of IE 8/9/10/11 usage, you might want to shy away from building a JS-heavy app. Likewise, if you have a high percentage of mobile users you might decide to prioritise mobile UX or performance.
Final thoughts
It’s clear that crafting a browser matrix is not an exact science. But taking a data-driven approach can help you to make informed decisions during development and testing. It’s also important to update your matrix on a regular basis, to keep track of upcoming browsers (e.g. Edge), declining browsers (e.g. IE) and mobile trends. An up-to-date browser matrix helps you and your team to develop and test with users in mind. It also ensures that your technology and design choices reflect market realities.
Further reading
- The Browser Statistics That Matter – Chris Coyier, Media Temple
The reason you can’t use global statistics as a stand-in for your own is because they could be wildly wrong. Even keeping a wide angle lens here, different continents (and even countries) have different breakdowns in usage. Zoom in a little and different industries and markets have different breakdowns. Zoom all the way in and your website will have browser usage statistics totally unique to you.
- Browser Trends December 2016: Mobile Overtakes Desktop – Craig Buckler, Sitepoint
Does the mobile explosion change our development lives? Probably not if you’ve been reading SitePoint and watching industry trends: you’re already mobile aware. Fortunately, it will be a wake-up call for any client or boss who doubted the growth of the mobile platform or didn’t think it would affect their business. Be prepared for several “how can we make our digital experience better on a smartphone” conversations very soon.
Leave a Reply